

根据dwd_ds_hudi库中的表统计每个省每月下单的数量和下单的总金额,并按照year,month,region_id进行分组,按照total_amount逆序排序,形成sequence值,将计算结果存入Hudi的dws_ds_hudi数据库province_consumption_day_aggr表中(表结构如下),然后使用spark-shell根据订单总数、订单总金额、省份表主键均为降序排序,查询出前5条,在查询时对于订单总金额字段将其转为bigint类型(避免用科学计数法展示),将SQL语句复制粘贴至客户端桌面【Release任务B提交结果.docx】中对应的任务序号下,将执行结果截图粘贴至客户端桌面【Release任务B提交结果.docx】中对应的任务序号下;
| 字段 | 类型 | 中文含义 | 备注 |
|---|---|---|---|
| uuid | string | 随机字符 | 随机字符,保证不同即可,作为primaryKey |
| province_id | int | 省份表主键 | |
| province_name | string | 省份名称 | |
| region_id | int | 地区主键 | |
| region_name | string | 地区名称 | |
| total_amount | double | 订单总金额 | 当月订单总金额 |
| total_count | int | 订单总数 | 当月订单总数。同时可作为preCombineField(作为合并字段时,无意义,因为主键为随机生成) |
| sequence | int | 次序 | |
| year | int | 年 | 订单产生的年,为动态分区字段 |
| month | int | 月 | 订单产生的月,为动态分区字段 |
将任务2的SQL语句写入到user_consumption_day_aggr.scala文件中,代码如下:
//(1)
spark.sql(
"""
|create table if not exists `dws_ds_hudi`.`user_consumption_day_aggr` (
|`uuid` string comment '随机字符',
|`user_id` int comment '客户主键',
|`user_name` string comment '客户名称',
|`total_amount` double comment '订单总金额',
|`total_count` int comment '订单总数',
|`year` int comment '年',
|`month` int comment '月',
|`day` int comment '日'
| )using hudi
|options (
| type = 'cow',
| primaryKey = 'uuid',
| preCombineField = 'total_count'
|)
|partitioned by (`year`,`month`,`day`);
|""".stripMargin)
//(2)
spark.sql(
""" insert overwrite `dws_ds_hudi`.`user_consumption_day_aggr`
| select
| uuid() as `uuid`,
| a.`user_id`,
| max(b.`name`) as `user_name`,
| sum(coalesce(a.`total_amount`,0)) as `total_amount`,
| count(a.`id`) `total_count`,
| cast(SUBSTRING(a.`create_time`,0,4) as int) as `year`,
| cast(SUBSTRING(a.`create_time`,5,2) as int) as `month`,
| cast(SUBSTRING(a.`create_time`,8,2) as int) as `day`
| from `dwd_ds_hudi`.`fact_order_info` a
| left join
| (select * from `dwd_ds_hudi`.`dim_user_info` where etl_date='20230901') b
| on a.`user_id`=b.`id`
| group by
| a.`user_id`,
| cast(SUBSTRING(a.`create_time`,0,4) as int) ,
| cast(SUBSTRING(a.`create_time`,5,2) as int) ,
| cast(SUBSTRING(a.`create_time`,8,2) as int)
|""".stripMargin)
//(3)
spark.sql("select * from `dws_ds_hudi`.`user_consumption_day_aggr` order by `user_id` desc, `total_amount` desc limit 5 ").show()
新建user_consumption_day_aggr.sh脚本文件,编写内容如下:
/opt/spark-3.2.3-bin-hadoop3.2/bin/spark-shell
--conf 'spark.serializer=org.apache.spark.serializer.KryoSerializer'
--conf 'spark.sql.catalog.spark_catalog=org.apache.spark.sql.hudi.catalog.HoodieCatalog'
--conf 'spark.sql.extensions=org.apache.spark.sql.hudi.HoodieSparkSessionExtension' < /rgsoft/Desktop/Study/task/user_consumption_day_aggr.scala
将任务3的SQL语句写入到province_consumption_day_aggr.scala文件中,代码如下:
//(1)
spark.sql(
"""
|create table if not exists `dws_ds_hudi`.`province_consumption_day_aggr` (
|`uuid` string comment '随机字符',
|`province_id` int comment '省份表主键',
|`province_name` string comment '省份名称',
|`region_id` int comment '地区主键',
|`region_name` string comment '地区名称',
|`total_amount` double comment '订单总金额',
|`total_count` int comment '订单总数',
|`sequence` int comment '次序',
|`year` int comment '年',
|`month` int comment '月'
| )using hudi
|options (
| type = 'cow',
| primaryKey = 'uuid',
| preCombineField = 'total_count'
|)
|partitioned by (`year`,`month`);
|""".stripMargin)
//(2)
spark.sql(
""" insert overwrite `dws_ds_hudi`.`province_consumption_day_aggr`
| select
| uuid() as `uuid`,
| d.`province_id`,
| d.`province_name`,
| d.`region_id`,
| d.`region_name` ,
| d.`total_amount`,
| d.`total_count`,
| row_number() over (partition by `year`,`month`,`region_id` order by `total_amount` desc ) as `sequence`,
| d.`year`,
| d.`month`
| from
| (select
| a.`province_id`,
| max(b.`name`) as `province_name`,
| b.`region_id`,
| max(c.`region_name`) as region_name ,
| sum(coalesce(a.`total_amount`,0)) as `total_amount`,
| count(a.`id`) `total_count`,
| cast(SUBSTRING(a.`create_time`,0,4) as int) as `year`,
| cast(SUBSTRING(a.`create_time`,5,2) as int) as `month`
| from `dwd_ds_hudi`.`fact_order_info` a
| left join
| (select * from `dwd_ds_hudi`.`dim_province` where etl_date='20230901') b
| on a.`province_id`=b.`id`
| left join
| (select * from `dwd_ds_hudi`.`dim_region` where etl_date='20230901') c
| on b.`region_id`=c.`id`
| group by
| a.`province_id`,
| b.`region_id`,
| cast(SUBSTRING(a.`create_time`,0,4) as int) ,
| cast(SUBSTRING(a.`create_time`,5,2) as int)
| ) d
|""".stripMargin)
//(3)
spark.sql("select * from `dws_ds_hudi`.`province_consumption_day_aggr`order by `total_count` desc,`total_amount` desc,`province_id` desc limit 5 ").show()
新建province_consumption_day_aggr.sh脚本文件,编写内容如下:
/opt/spark-3.2.3-bin-hadoop3.2/bin/spark-shell
--conf 'spark.serializer=org.apache.spark.serializer.KryoSerializer'
--conf 'spark.sql.catalog.spark_catalog=org.apache.spark.sql.hudi.catalog.HoodieCatalog'
--conf 'spark.sql.extensions=org.apache.spark.sql.hudi.HoodieSparkSessionExtension' < /rgsoft/Desktop/Study/task/province_consumption_day_aggr.scala
将任务4的SQL语句写入到provinceavgcmpregion.scala文件中,代码如下:
//(1)
spark.sql(
"""
|create table if not exists `dws_ds_hudi`.`provinceavgcmpregion` (
|`uuid` string,
|`provinceid` int comment '省份表主键',
|`provincename` string comment '省份名称',
|`provinceavgconsumption` double comment '该省平均订单金额',
|`region_id` int comment '地区表主键',
|`region_name` string comment '地区名称',
|`regionavgconsumption` double comment '地区平均订单金额',
|`comparison` string comment '比较结果'
| )using hudi
|options (
| type = 'cow',
| primaryKey = 'uuid'
|)
|""".stripMargin)
//(2)
spark.sql(
"""
|insert overwrite `dws_ds_hudi`.`provinceavgcmpregion`
|select uuid() as `uuid`,a.`province_id`,a.`province_name`,a.`provinceavgconsumption`,a.`region_id`,a.`region_name`,a.`regionavgconsumption`,
| case
| when a.`provinceavgconsumption`=a.`regionavgconsumption` then '相等'
| when a.`provinceavgconsumption`>a.`regionavgconsumption` then '高'
| else '低'
| end as `comparison`
| from
|(select distinct
|province_id,
|province_name,
|sum( case when year=2020 and month=4 then `total_amount` else 0 end) over(partition by province_id )/sum(case when year=2020 and month=4 then `total_count` else 0 end) over(partition by province_id ) as `provinceavgconsumption`,
|region_id,
|region_name,
|sum(`total_amount`) over(partition by region_id)/sum(`total_count`) over(partition by region_id) as `regionavgconsumption`
|from `dws_ds_hudi`.`province_consumption_day_aggr`) a
|
|""".stripMargin)
//(3)
spark.sql(
"""
| create temporary view tmp
| using org.apache.spark.sql.jdbc
|options(
| url 'jdbc:mysql://127.0.0.1:3306/shtd_result?useSSL=false&useUnicode=true&characterEncoding=utf8',
| dbtable 'provinceavgcmpregion',
| user 'root1',
| password '123456'
|)
|""".stripMargin)
//(4)
spark.sql(
"""
|insert overwrite tmp
|select
|`provinceid`,
|`provincename`,
|`provinceavgconsumption`,
|`region_id`,
|`region_name`,
|`regionavgconsumption`,
|`comparison`
|from `dws_ds_hudi`.`provinceavgcmpregion`
|""".stripMargin)
//(5)
spark.sql("select * from tmp order by `provinceid` desc,`provinceavgconsumption` desc,`regionavgconsumption` desc limit 5").show()
新建provinceavgcmpregion.sh脚本文件,编写内容如下:
/opt/spark-3.2.3-bin-hadoop3.2/bin/spark-shell
--conf 'spark.serializer=org.apache.spark.serializer.KryoSerializer'
--conf 'spark.sql.catalog.spark_catalog=org.apache.spark.sql.hudi.catalog.HoodieCatalog'
--conf 'spark.sql.extensions=org.apache.spark.sql.hudi.HoodieSparkSessionExtension' < /rgsoft/Desktop/Study/task/provinceavgcmpregion.scala
新建computeindex234.project文件,定义工作流版本信息,编写内容如下:
azkaban-flow-version: 2.0
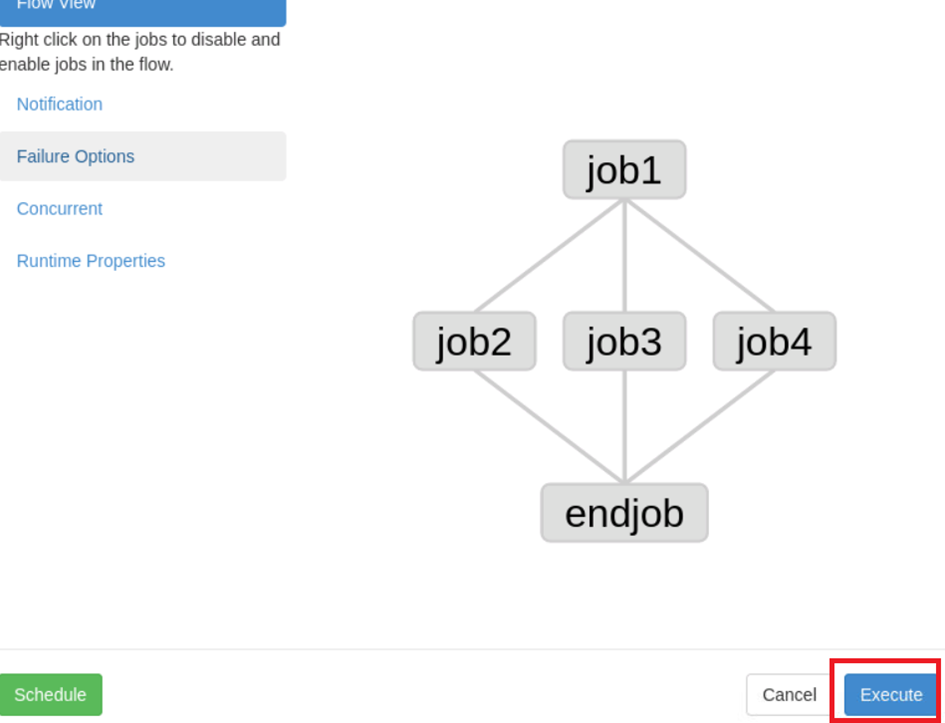
新建computeindex234.flow文件,定义工作流节点信息,编写内容如下:
nodes
namejob1
typecommand
config
commandecho '开始'
namejob2
typecommand
dependsOn
job1
config
commandsh user_consumption_day_aggr.sh
namejob3
typecommand
dependsOn
job1
config
commandsh province_consumption_day_aggr.sh
namejob4
typecommand
dependsOn
job1
config
commandsh provinceavgcmpregion.sh
nameendjob
typecommand
dependsOn
job2
job3
job4
config
commandecho '结束'
在终端执行如下命令,将上面的所有sh脚本文件和azkaban配置文件压缩到zip文件中。
zip -r computeindex234.zip computeindex234.* *.sh
在终端执行如下命令,启动azkaban
cd  /opt/azkaban-solo-server-3.91.0/
bin/start-solo.sh
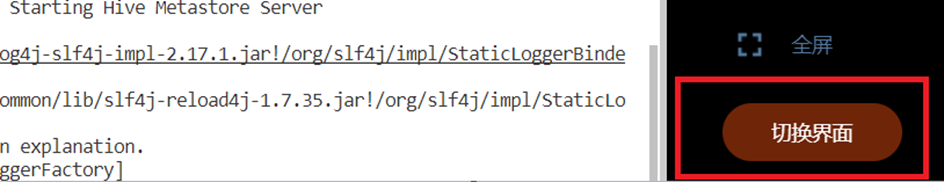
切换界面到可视化桌面
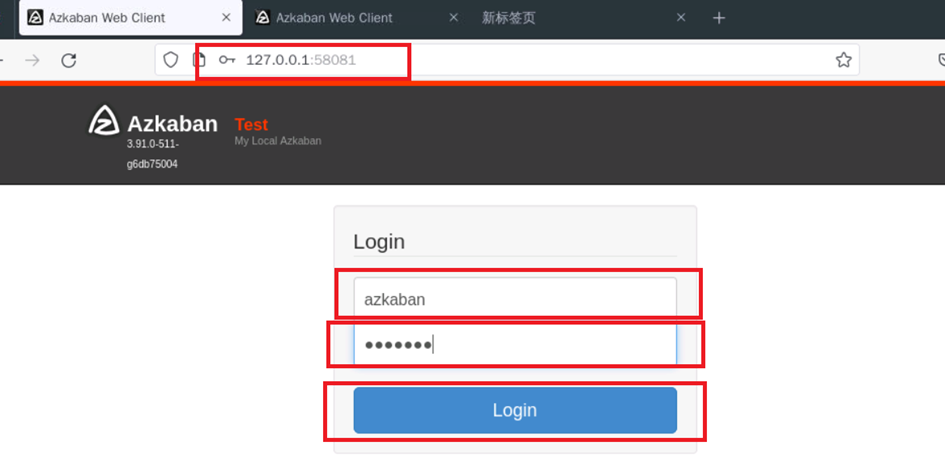
打开火狐浏览器输入http://127.0.0.1:58081/,并输入账号 azkaban和密码azkaban进行登录
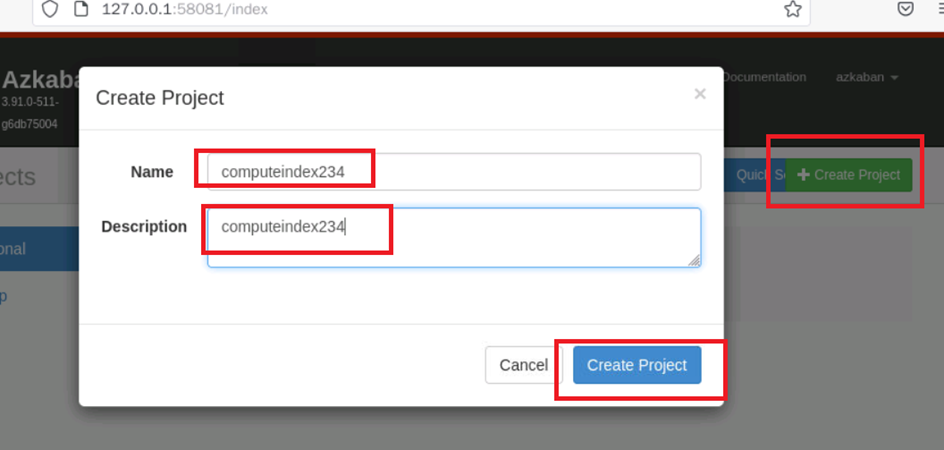
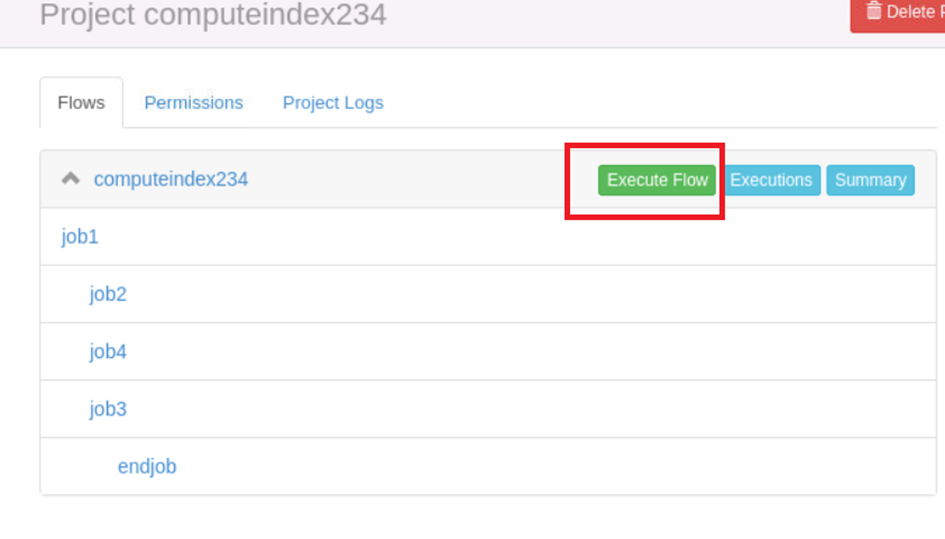
在azkaban中创建工程
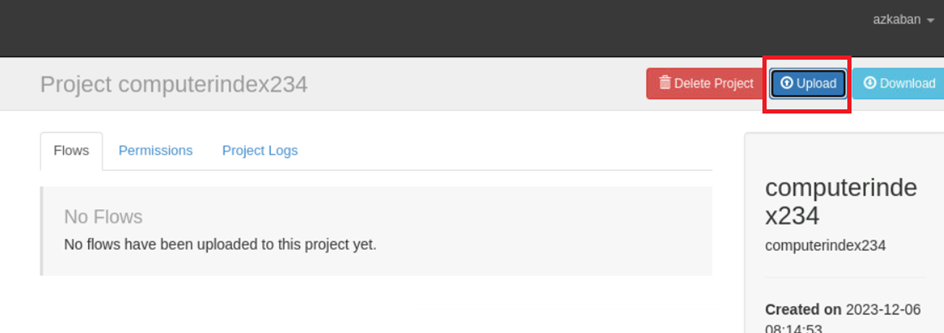
在azkaban的工程中上传打包好的压缩包文件
根据dwd_ds_hudi层表统计每人每天下单的数量和下单的总金额,存入Hudi的dws_ds_hudi层的user_consumption_day_aggr表中(表结构如下),然后使用spark -shell按照客户主键、订单总金额均为降序排序,查询出前5条,将SQL语句复制粘贴至客户端桌面【Release任务B提交结果.docx】中对应的任务序号下,将执行结果截图粘贴至客户端桌面【Release任务B提交结果.docx】中对应的任务序号下;
| 字段 | 类型 | 中文含义 | 备注 |
|---|---|---|---|
| uuid | string | 随机字符 | 随机字符,保证不同即可,作为primaryKey |
| user_id | int | 客户主键 | |
| user_name | string | 客户名称 | |
| total_amount | double | 订单总金额 | 当天订单总金额。 |
| total_count | int | 订单总数 | 当天订单总数。同时可作为preCombineField(作为合并字段时,无意义,因为主键为随机生成) |
| year | int | 年 | 订单产生的年,为动态分区字段 |
| month | int | 月 | 订单产生的月,为动态分区字段 |
| day | int | 日 | 订单产生的日,为动态分区字段 |
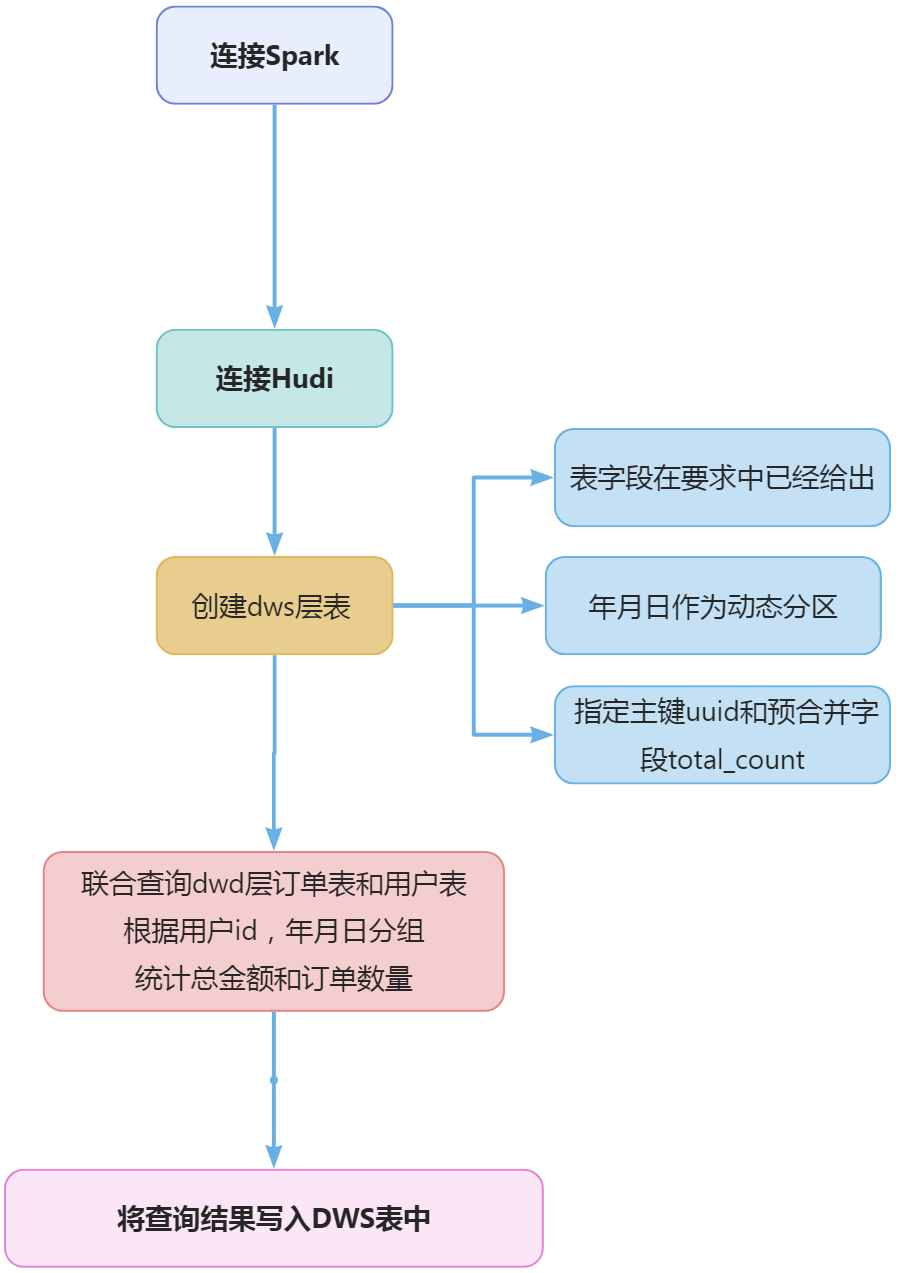
连接spark
spark-shell  --conf 'spark.serializer=org.apache.spark.serializer.KryoSerializer'
--conf 'spark.sql.catalog.spark_catalog=org.apache.spark.sql.hudi.catalog.HoodieCatalog'
--conf 'spark.sql.extensions=org.apache.spark.sql.hudi.HoodieSparkSessionExtension'
根据任务要求给出的表结构,在hudi中创建表,建表语句如下:
spark.sql(
  """
    |create table if not exists `dws_ds_hudi`.`user_consumption_day_aggr` (
    |`uuid` string  comment '随机字符',
    |`user_id`  int comment '客户主键',
    |`user_name`    string  comment '客户名称',
    |`total_amount` double  comment '订单总金额',
    |`total_count`  int comment '订单总数',
    |`year` int comment '年',
    |`month`    int comment '月',
    |`day`  int comment '日'
    |  )using hudi
    |options (
    |  type = 'cow',
    |  primaryKey = 'uuid',
    |  preCombineField = 'total_count'
    |)
    |partitioned by (`year`,`month`,`day`);
    |""".stripMargin)
也就是根据用户id和年月日分组,然后对订单的金额求和,就是每个用户每天的消费金额。需要注意的是如何从时间中获取年月日,在这里可以用SUBSTRING函数来截取时间字符串中的年、月、日,截取后再转换为整型。
cast(SUBSTRING(a.`create_time`,0,4) as int) -- 年 --
cast(SUBSTRING(a.`create_time`,5,2) as int) -- 月 --
cast(SUBSTRING(a.`create_time`,8,2) as int) -- 日 --
通过uuid()函数来生成一个随机数作为主键。由于uuid()函数生成的随机数是永远不会重复的,所以可以作为主键。 由于任务要求的表结构中必须要有用户名称,但是用户名称并不在订单表中,所以需要关联查询用户表,完整的统计sql语句如下:
spark.sql(
  """ insert overwrite  `dws_ds_hudi`.`user_consumption_day_aggr`
    | select
    | uuid() as `uuid`,
    | a.`user_id`,
    | max(b.`name`) as `user_name`,
    | sum(coalesce(a.`total_amount`,0)) as  `total_amount`,
    | count(a.`id`) `total_count`,
    | cast(SUBSTRING(a.`create_time`,0,4) as int) as `year`,
    | cast(SUBSTRING(a.`create_time`,5,2) as int) as `month`,
    | cast(SUBSTRING(a.`create_time`,8,2) as int) as `day`
    | from  `dwd_ds_hudi`.`fact_order_info` a
    | left join
    | (select * from `dwd_ds_hudi`.`dim_user_info` where  etl_date='20230901') b
    | on a.`user_id`=b.`id`
    | group by
    | a.`user_id`,
    | cast(SUBSTRING(a.`create_time`,0,4) as int) ,
    | cast(SUBSTRING(a.`create_time`,5,2) as int) ,
    | cast(SUBSTRING(a.`create_time`,8,2) as int)
    |""".stripMargin)
spark.sql("select * from `dws_ds_hudi`.`user_consumption_day_aggr` order by `user_id` desc, `total_amount` desc limit 5 ").show()
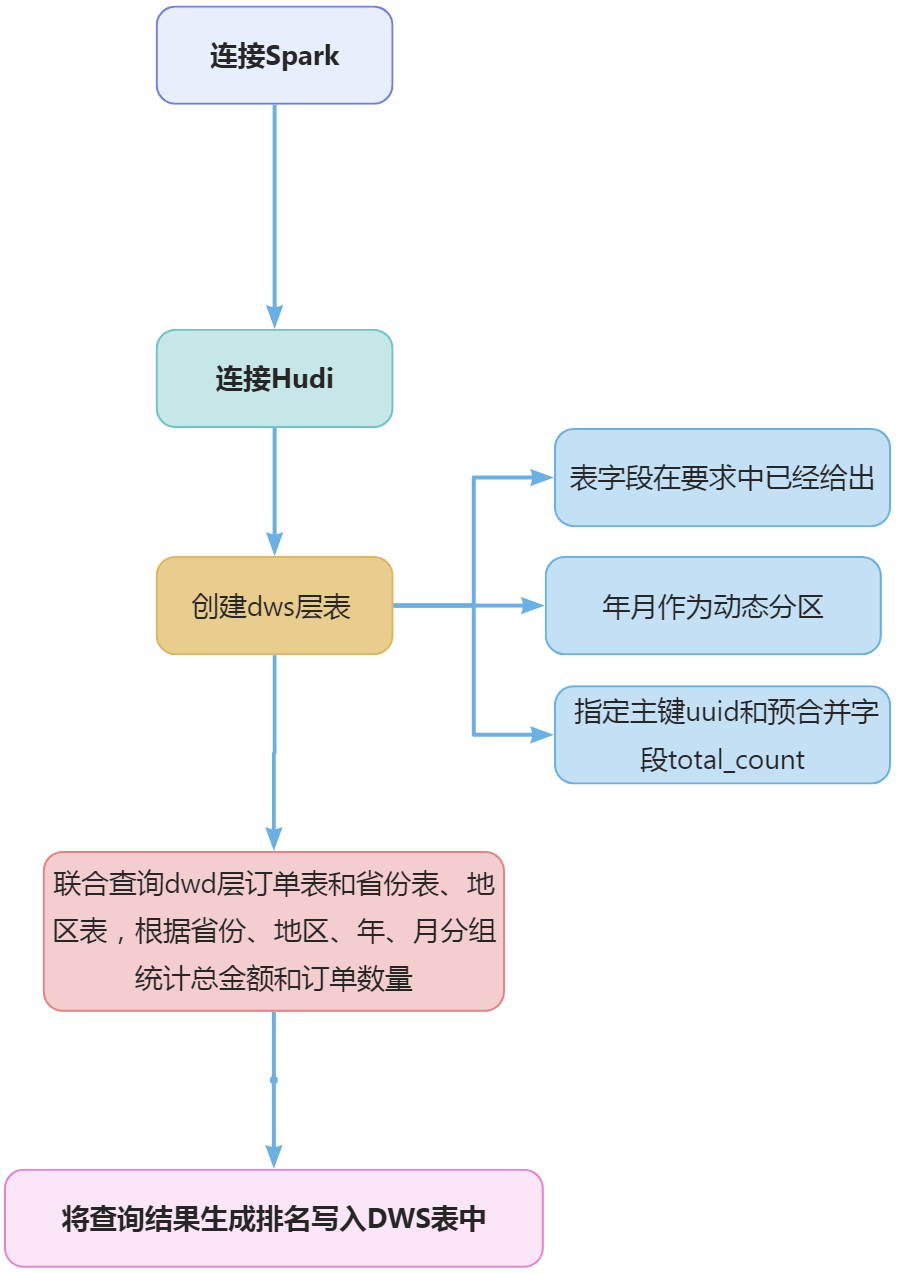
根据dwd_ds_hudi库中的表统计每个省每月下单的数量和下单的总金额,并按照year,month,region_id进行分组,按照total_amount逆序排序,形成sequence值,将计算结果存入Hudi的dws_ds_hudi数据库province_consumption_day_aggr表中(表结构如下),然后使用spark-shell根据订单总数、订单总金额、省份表主键均为降序排序,查询出前5条,在查询时对于订单总金额字段将其转为bigint类型(避免用科学计数法展示),将SQL语句复制粘贴至客户端桌面【Release任务B提交结果.docx】中对应的任务序号下,将执行结果截图粘贴至客户端桌面【Release任务B提交结果.docx】中对应的任务序号下;
| 字段 | 类型 | 中文含义 | 备注 |
|---|---|---|---|
| uuid | string | 随机字符 | 随机字符,保证不同即可,作为primaryKey |
| province_id | int | 省份表主键 | |
| province_name | string | 省份名称 | |
| region_id | int | 地区主键 | |
| region_name | string | 地区名称 | |
| total_amount | double | 订单总金额 | 当月订单总金额 |
| total_count | int | 订单总数 | 当月订单总数。同时可作为preCombineField(作为合并字段时,无意义,因为主键为随机生成) |
| sequence | int | 次序 | |
| year | int | 年 | 订单产生的年,为动态分区字段 |
| month | int | 月 | 订单产生的月,为动态分区字段 |
spark.sql(
  """
    |create table if not exists `dws_ds_hudi`.`province_consumption_day_aggr` (
    |`uuid` string  comment '随机字符',
    |`province_id`  int comment '省份表主键',
    |`province_name`    string  comment '省份名称',
    |`region_id`    int comment '地区主键',
    |`region_name`  string  comment '地区名称',
    |`total_amount` double  comment '订单总金额',
    |`total_count`  int comment '订单总数',
    |`sequence` int comment '次序',
    |`year` int comment '年',
    |`month`    int comment '月'
    |  )using hudi
    |options (
    |  type = 'cow',
    |  primaryKey = 'uuid',
    |  preCombineField = 'total_count'
    |)
    |partitioned by (`year`,`month`);
    |""".stripMargin)
参考上一个任务获取年月日的方式获取年和月的值,由于任务中要求的表结构中要有省份和地区的名称和id信息,所以需要订单表关联查询地区表和省份表,才能获取到对应的信息。根据省份id,地区id,年,月分组后,对订单金额和数量求和就是我们需要的结果。sql语句如下
spark.sql(
  """ select
    | a.`province_id`,
    | max(b.`name`) as `province_name`,
    | b.`region_id`,
    | max(c.`region_name`) as region_name ,
    | sum(coalesce(a.`total_amount`,0)) as  `total_amount`,
    | count(a.`id`) `total_count`,
    | cast(SUBSTRING(a.`create_time`,0,4) as int) as `year`,
    | cast(SUBSTRING(a.`create_time`,5,2) as int) as `month`
    | from  `dwd_ds_hudi`.`fact_order_info`  a
    | left join
    | (select * from `dwd_ds_hudi`.`dim_province` where  etl_date='20230901') b
    | on a.`province_id`=b.`id`
    | left join
    | (select * from `dwd_ds_hudi`.`dim_region` where  etl_date='20230901') c
    | on b.`region_id`=c.`id`
    | group by
    | a.`province_id`,
    | b.`region_id`,
    | cast(SUBSTRING(a.`create_time`,0,4) as int) ,
    | cast(SUBSTRING(a.`create_time`,5,2) as int)
    |""".stripMargin)
在上面一个步骤中统计了各个省份的月订单金额和订单数量,只需要对上面的结果生成序号就是任务要求的最终结果。序号的生成可以通过row_number()函数来实现,需要根据年、月、地区分区,订单金额进行倒序排序,row_number()函数使用示例如下:
row_number() over (partition by `year`,`month`,`region_id` order by `total_amount` desc ) as `sequence`
解决排名问题后,整合上一步骤的sql,完整的SQL语句如下:
spark.sql(
  """ insert overwrite `dws_ds_hudi`.`province_consumption_day_aggr`
    | select
    |  uuid() as `uuid`,
    | d.`province_id`,
    | d.`province_name`,
    | d.`region_id`,
    | d.`region_name` ,
    | d.`total_amount`,
    | d.`total_count`,
    |  row_number() over (partition by `year`,`month`,`region_id` order by `total_amount` desc  ) as `sequence`,
    | d.`year`,
    | d.`month`
    | from
    | (select
    | a.`province_id`,
    | max(b.`name`) as `province_name`,
    | b.`region_id`,
    | max(c.`region_name`) as region_name ,
    | sum(coalesce(a.`total_amount`,0)) as  `total_amount`,
    | count(a.`id`) `total_count`,
    | cast(SUBSTRING(a.`create_time`,0,4) as int) as `year`,
    | cast(SUBSTRING(a.`create_time`,5,2) as int) as `month`
    | from  `dwd_ds_hudi`.`fact_order_info`  a
    | left join
    | (select * from `dwd_ds_hudi`.`dim_province` where  etl_date='20230901') b
    | on a.`province_id`=b.`id`
    | left join
    | (select * from `dwd_ds_hudi`.`dim_region` where  etl_date='20230901') c
    | on b.`region_id`=c.`id`
    | group by
    | a.`province_id`,
    | b.`region_id`,
    | cast(SUBSTRING(a.`create_time`,0,4) as int) ,
    | cast(SUBSTRING(a.`create_time`,5,2) as int)
    | ) d
    |""".stripMargin)
spark.sql("select * from `dws_ds_hudi`.`province_consumption_day_aggr`order by `total_count` desc,`total_amount` desc,`province_id` desc limit 5 ").show()
请根据dws_ds_hudi库中的表计算出每个省份2020年4月的平均订单金额和该省所在地区平均订单金额相比较结果(“高/低/相同”),存入ClickHouse数据库shtd_result的provinceavgcmpregion表中(表结构如下),然后在Linux的ClickHouse命令行中根据省份表主键、省平均订单金额、地区平均订单金额均为降序排序,查询出前5条,将SQL语句复制粘贴至客户端桌面【Release任务B提交结果.docx】中对应的任务序号下,将执行结果截图粘贴至客户端桌面【Release任务B提交结果.docx】中对应的任务序号下;
| 字段 | 类型 | 中文含义 | 备注 |
|---|---|---|---|
| provinceid | int | 省份表主键 | |
| provincename | text | 省份名称 | |
| provinceavgconsumption | double | 该省平均订单金额 | |
| region_id | int | 地区表主键 | |
| region_name | text | 地区名称 | |
| regionavgconsumption | double | 地区平均订单金额 | 该省所在地区平均订单金额 |
| comparison | text | 比较结果 | 省平均订单金额和该省所在地区平均订单金额比较结果,值为:高/低/相同 |
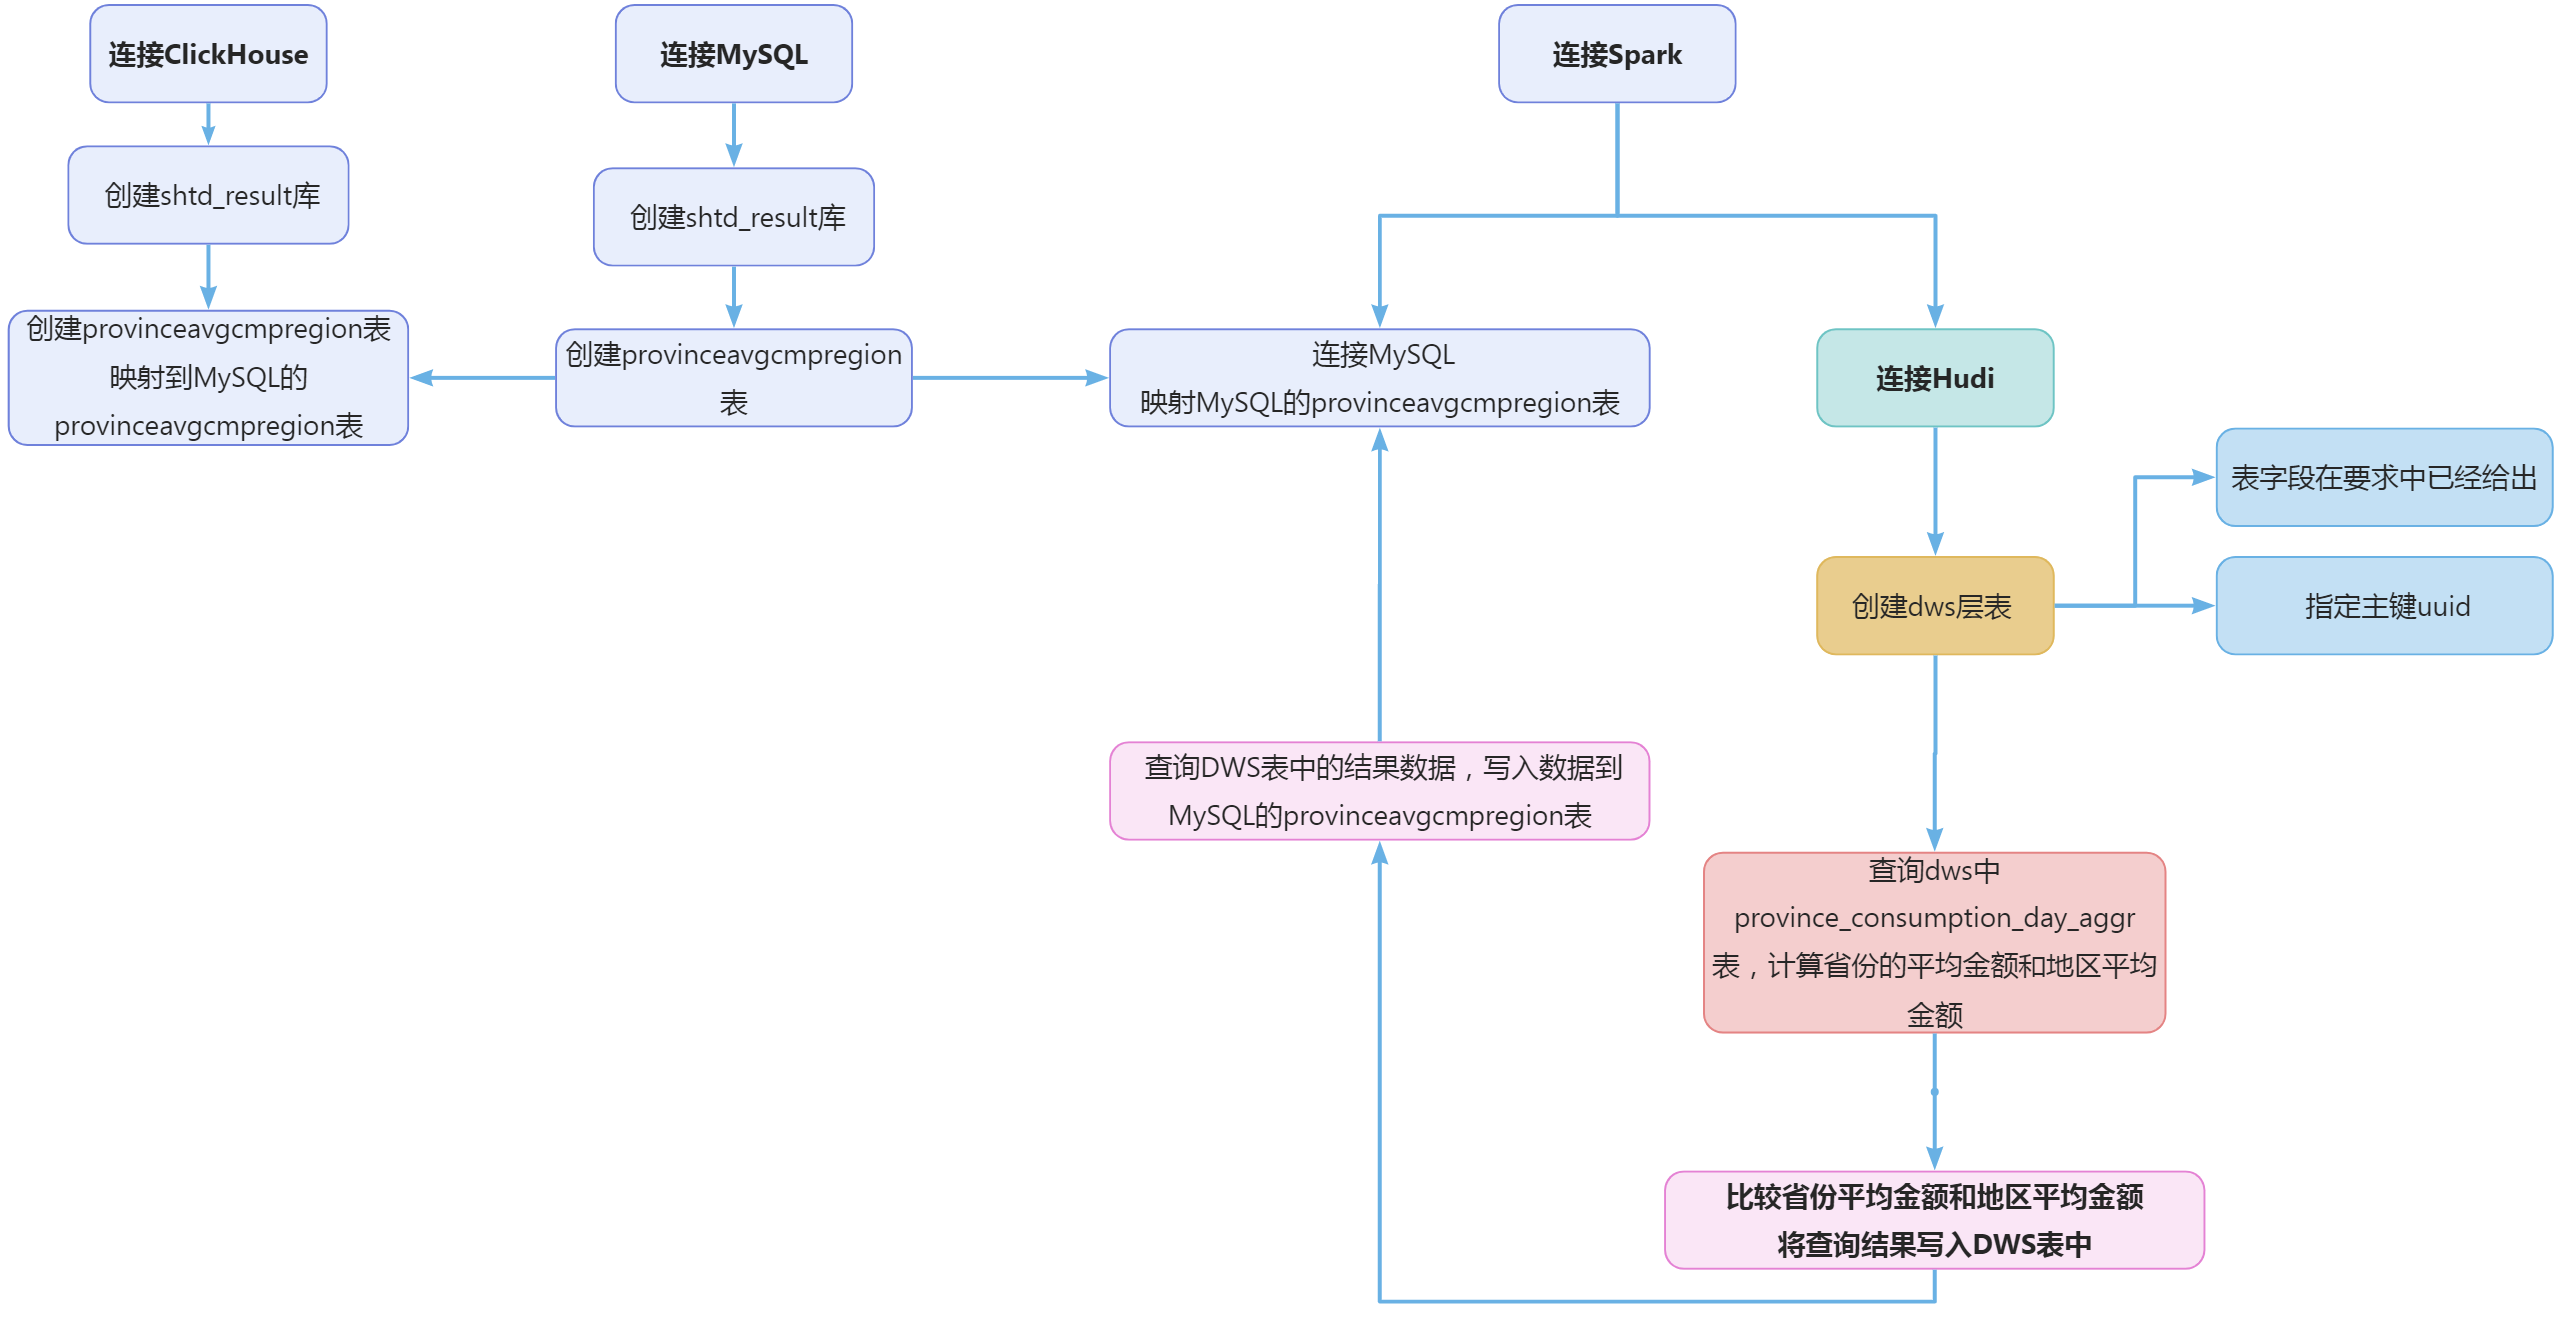
在终端执行如下命令连接MySQL
mysql -uadmin -p123456
在MySQL终端执行建库语句
create database if not exists shtd_result;
根据任务要求提供的表结构,在MySQL终端执行建表语句
create table if not exists `shtd_result`.`provinceavgcmpregion`(
  `provinceid` int  comment '省份表主键',
  `provincename`  varchar(2000) comment '省份名称',
  `provinceavgconsumption` double comment '该省平均订单金额',
  `region_id` int comment '地区表主键',
  `region_name`  varchar(2000) comment '地区名称',
  `regionavgconsumption` double comment '地区平均订单金额',
  `comparison`  varchar(2000) comment '比较结果'
)ENGINE = InnoDB AUTO_INCREMENT = 2 CHARACTER SET = utf8 COLLATE = utf8_general_ci COMMENT = '' ROW_FORMAT = Dynamic;
在终端执行如下命令,启动clickhouse并查看clickhouse运行状态
service clickhouse-server start
service clickhouse-server status
在终端执行如下命令,连接clickhouse
clickhouse-client -u default --port 9800
在clickhouse终端执行建库语句
create database if not exists shtd_result;
在clickhouse终端执行建表语句,映射表到MySQL的provinceavgcmpregion表
 create table if not exists shtd_result.provinceavgcmpregion
 (provinceid    int,
  provincename  text,
  provinceavgconsumption    double,
  region_id int ,
  region_name   text,
  regionavgconsumption  double,
  comparison    text
 )ENGINE = MySQL('127.0.0.1:3306','shtd_result','provinceavgcmpregion','root1','123456');
spark-shell  --conf 'spark.serializer=org.apache.spark.serializer.KryoSerializer'
--conf 'spark.sql.catalog.spark_catalog=org.apache.spark.sql.hudi.catalog.HoodieCatalog'
--conf 'spark.sql.extensions=org.apache.spark.sql.hudi.HoodieSparkSessionExtension'
根据任务要求提供的表结构,建立dws_ds_hudi.provinceavgcmpregion hudi表。建表语句如下:
spark.sql(
  """
    |create table if not exists `dws_ds_hudi`.`provinceavgcmpregion` (
    |`uuid` string,
    |`provinceid`   int comment '省份表主键',
    |`provincename` string  comment '省份名称',
    |`provinceavgconsumption`   double  comment '该省平均订单金额',
    |`region_id`    int comment '地区表主键',
    |`region_name`  string  comment '地区名称',
    |`regionavgconsumption` double  comment '地区平均订单金额',
    |`comparison`   string  comment '比较结果'
    |  )using hudi
    |options (
    |  type = 'cow',
    |  primaryKey = 'uuid'
    |)
    |""".stripMargin)
在上一个任务中我们已经统计和各个省份各月份的订单金额,在这个任务中我们只需要查询上一个任务的结果表进行统计即可。根据任务要求统计的是2020年4月份的地区和省份平均订单金额。 省份的平均订单金额是将4月份的订单额除以数量。
sum( case when year=2020 and month=4 then `total_amount` else 0 end) over(partition by province_id )/sum(case when year=2020 and month=4 then `total_count` else 0 end) over(partition by province_id ) as `provinceavgconsumption`
地区的平均订单金额则需要根据地区id分区后求平均值。
sum(`total_amount`) over(partition by region_id)/sum(`total_count`) over(partition by region_id) as `regionavgconsumption`
完整的SQL如下:
spark.sql(
  """
    |select distinct
    |province_id,
    |province_name,
    |sum( case when year=2020 and month=4 then `total_amount` else 0 end) over(partition by province_id )/sum(case when year=2020 and month=4 then `total_count` else 0 end) over(partition by province_id ) as `provinceavgconsumption`,
    |region_id,
    |region_name,
    |sum(`total_amount`) over(partition by region_id)/sum(`total_count`) over(partition by  region_id)  as `regionavgconsumption`
    |from `dws_ds_hudi`.`province_consumption_day_aggr`
    |""".stripMargin)
在上一步骤中已经计算出了省份和地区的平均订单金额,根据任务要求需要比较后给出“相等”、“高”、“低”的评价,在这里我们可以使用case when语句来处理。结合上一步骤的SQL语句,完整的SQL语句如下:
spark.sql(
  """
    |select uuid() as `uuid`,a.`province_id`,a.`province_name`,a.`provinceavgconsumption`,a.`region_id`,a.`region_name`,a.`regionavgconsumption`,
    |  case
    |   when a.`provinceavgconsumption`=a.`regionavgconsumption` then '相等'
    |   when a.`provinceavgconsumption`>a.`regionavgconsumption` then '高'
    |   else '低'
    |  end as `comparison`
    | from
    |(select distinct
    |province_id,
    |province_name,
    |sum( case when year=2020 and month=4 then `total_amount` else 0 end) over(partition by province_id )/sum(case when year=2020 and month=4 then `total_count` else 0 end) over(partition by province_id ) as `provinceavgconsumption`,
    |region_id,
    |region_name,
    |sum(`total_amount`) over(partition by region_id)/sum(`total_count`) over(partition by  region_id)  as `regionavgconsumption`
    |from `dws_ds_hudi`.`province_consumption_day_aggr`) a
    |
    |""".stripMargin)
将上一步骤的结果写入dws层的表中,SQL如下:
spark.sql(
  """
    |insert overwrite `dws_ds_hudi`.`provinceavgcmpregion`
    |select uuid() as `uuid`,a.`province_id`,a.`province_name`,a.`provinceavgconsumption`,a.`region_id`,a.`region_name`,a.`regionavgconsumption`,
    |  case
    |   when a.`provinceavgconsumption`=a.`regionavgconsumption` then '相等'
    |   when a.`provinceavgconsumption`>a.`regionavgconsumption` then '高'
    |   else '低'
    |  end as `comparison`
    | from
    |(select distinct
    |province_id,
    |province_name,
    |sum( case when year=2020 and month=4 then `total_amount` else 0 end) over(partition by province_id )/sum(case when year=2020 and month=4 then `total_count` else 0 end) over(partition by province_id ) as `provinceavgconsumption`,
    |region_id,
    |region_name,
    |sum(`total_amount`) over(partition by region_id)/sum(`total_count`) over(partition by  region_id)  as `regionavgconsumption`
    |from `dws_ds_hudi`.`province_consumption_day_aggr`) a
    |
    |""".stripMargin)
根据任务要求,需要将数据存入clickhouse,我们的解决办法是通过MySQL的provinceavgcmpregion作为中间表,在spark中将结果数据写入到MySQL表,然后在clickhouse中映射MySQL的provinceavgcmpregion表,这样就实现了分析结果写入clickhouse。所以在spark中我们也需要映射MySQL的provinceavgcmpregion表。sql语句如下:
spark.sql(
  """
    | create temporary view tmp
    |    using org.apache.spark.sql.jdbc
    |options(
    |    url 'jdbc:mysql://127.0.0.1:3306/shtd_result?useSSL=false&useUnicode=true&characterEncoding=utf8',
    |    dbtable 'provinceavgcmpregion',
    |    user 'root1',
    |    password '123456'
    |)
    |""".stripMargin)
在dws层的provinceavgcmpregion表中已经写入了统计好的结果数据,我们只需要将dws层的数据查询出来并写入MySQL中。SQL语句如下:
spark.sql(
  """
    |insert overwrite tmp
    |select
    |`provinceid`,
    |`provincename`,
    |`provinceavgconsumption`,
    |`region_id`,
    |`region_name`,
    |`regionavgconsumption`,
    |`comparison`
    |from `dws_ds_hudi`.`provinceavgcmpregion`
    |""".stripMargin)
在spark中查询写入到MySQL的数据,SQL语句如下:
spark.sql("select * from tmp order by `provinceid` desc,`provinceavgconsumption` desc,`regionavgconsumption` desc limit 5").show()
在Linux终端执行如下命令,连接clickhouse
clickhouse-client -u default --port 9800
在clickhouse终端执行如下命令,查询统计结果
select * from shtd_result.provinceavgcmpregion order by provinceid desc, provinceavgconsumption desc,regionavgconsumption desc limit 5
1 本站一切资源不代表本站立场,并不代表本站赞同其观点和对其真实性负责。
2 本站一律禁止以任何方式发布或转载任何违法的相关信息,访客发现请向站长举报
3 本站资源大多存储在云盘,如发现链接失效,请联系我们我们会第一时间更新。


暂无评论内容